Designed For:
Sales, customer service, logistics, and other personnel who need to graphically analyze and explore business data without having to write queries or understand the underlying database
High Performance Analytics and Visualization
for Operational Data
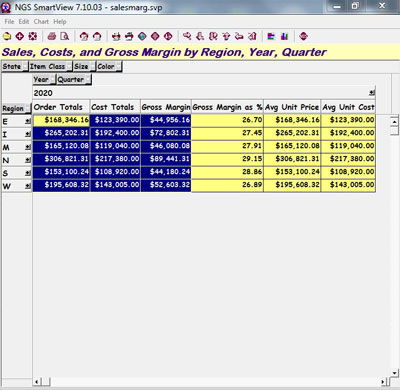
The Qport® SmartView module of NGS-IQ™ enables users to transform query output files into analytical presentations in seconds. You can study data such as budgets, sales, orders, payroll, inventory, and shipments by periods of time, companies, products, customers, vendors, and other factors. If you can think of a way you want to monitor your company's performance, and you have the data, you can visually analyze it with Qport SmartView.
Remarkably Powerful and Easy to Use
Qport SmartView enables anyone, not just IT professionals and Excel power users, to manipulate, study, pivot, chart, filter, drill into, export, and share important data without writing formulas, programs, or scripts.
It summarizes your view of your data based on how you organize the fields in your query output. You can have any number of drill-down levels in your matrix and summarize any number of data fields by row and column at each drill-down level.
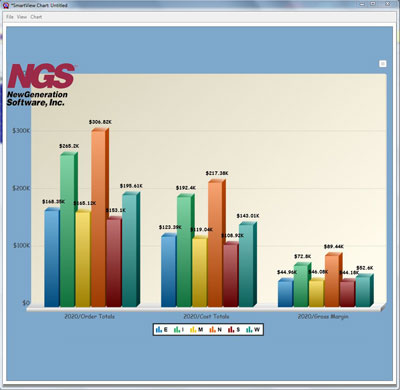
You can filter your view to isolate and contrast related business factors, calculate new values, export data sets to Excel and HTML, chart your data in a wide range of formats, and share data with other users. more

|
|


